 Semanticus
DAX Lab
Author and run DAX, see where the time goes (Formula Engine versus Storage Engine), benchmark cold against warm, prove a rewrite returns identical numbers before you keep it, and right-click any value to have it explained. DAX Lab is the measure workbench, and every button here is an MCP tool your AI Assistant can drive.
#In the Studio
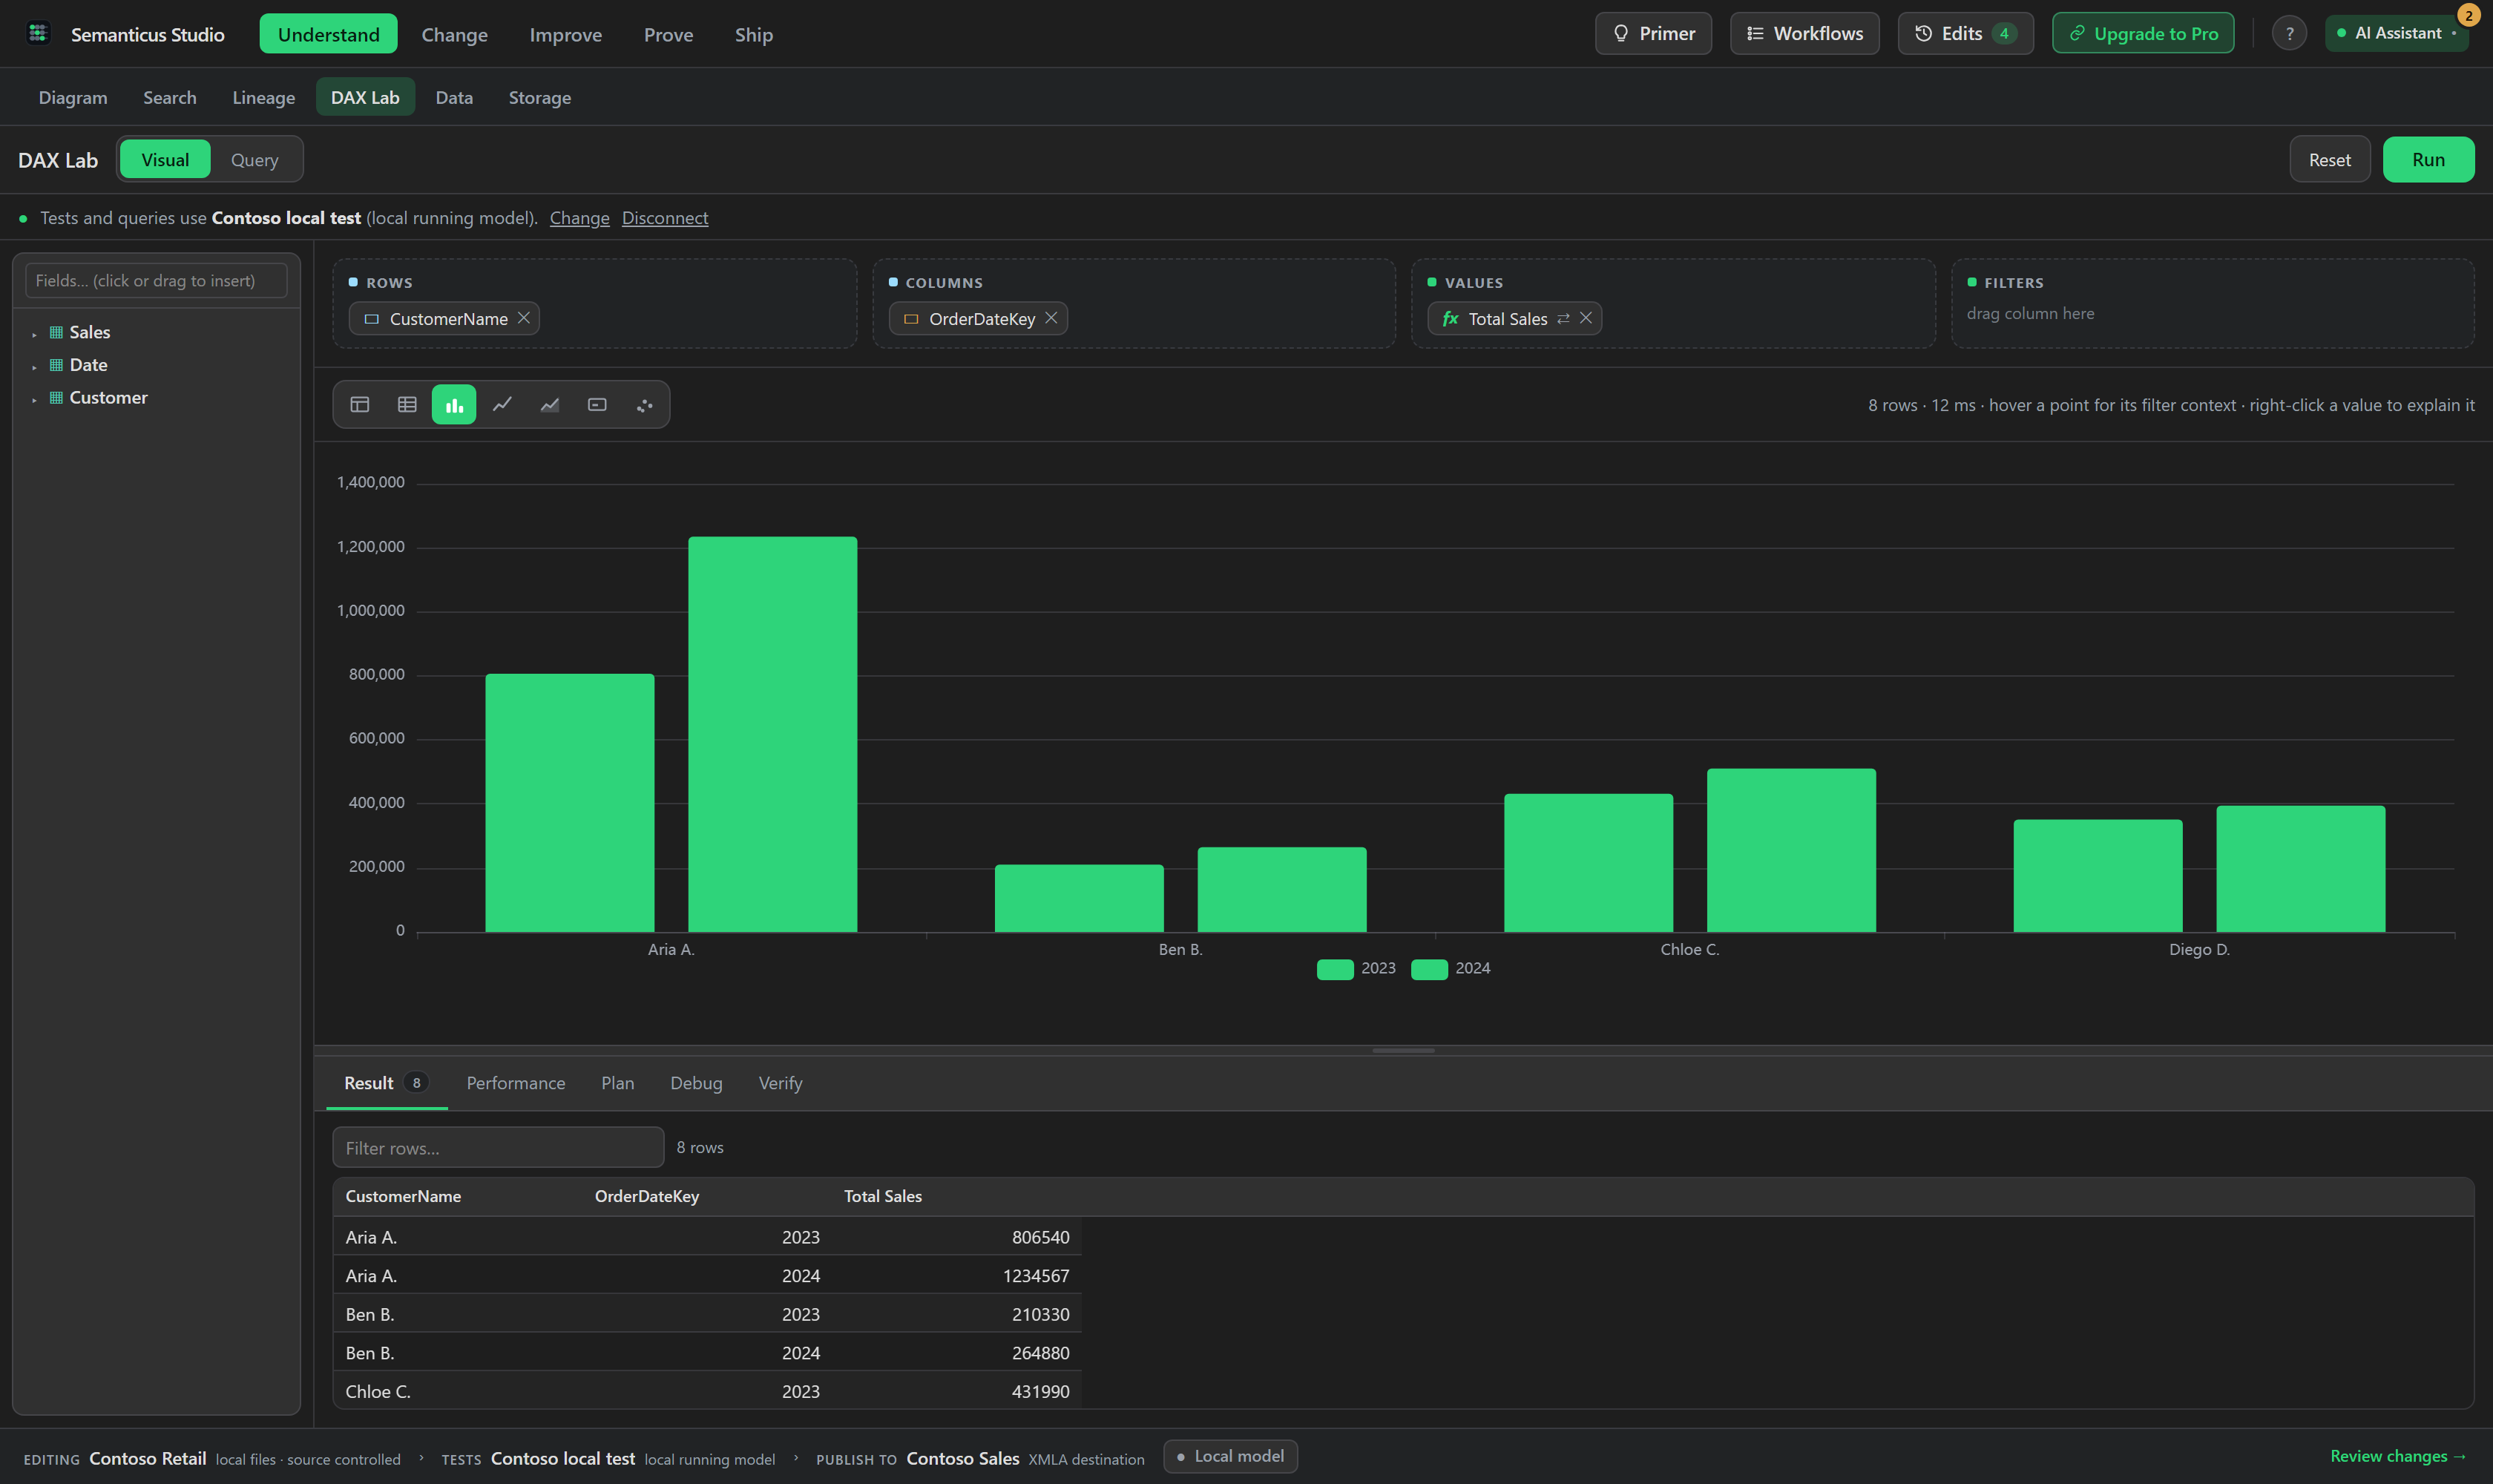
Write a query and run it against the connected model, results in a grid. Build a visual from field wells and hover any point to read its exact filter context, so you can see why a number is what it is.
Benchmark a query cold versus warm to expose the worst case, and profile it to see the Formula Engine versus Storage Engine split, the storage-engine scan count and CPU, and the heaviest scans. When a query is Formula-Engine-bound, capture its query plan to find the costly operators.
The optimise-and-prove loop is the headline. Give two or more candidate rewrites, and the engine verifies each returns identical values to the current measure across a group-by matrix you choose, benchmarks only the ones that matched, and surfaces the fastest that genuinely beats the original. Correctness always gates speed, so a faster-but-wrong candidate can never win. Auto-applying the winner is a Pro feature; on the free tier the same run returns the full evidence, paused, so you apply the winner yourself.
#Explain this number
Right-click any value in a DAX Lab matrix, the table visual or the results grid and choose Explain. A slide-over builds a dossier for that one cell, in plain sections: your selection (the value re-derived in the cell's exact filter context, the same query shape a real visual runs), what makes it up (the top contributors by a related dimension), what feeds it (the measure's dependency chain), where the data comes from (source lineage per column), and any row security that could apply. An Ask the AI Assistant to explain button copies a ready-to-paste prompt, so the evidence is assembled by the engine and the narration is up to you.
When the cell is blank, the dossier runs a why-is-this-blank checklist instead: do the filters remove every row (and which filter is the culprit), is there no relationship path to the filtering table, does the filter flow the wrong way or ride an inactive relationship, is the measure blank by design, or could row security be hiding rows. The strongest proven signal is named as the likely cause, and an empirically proven cause always outranks a structural suspicion.
Two honesty rules are built in. The contributor breakdown ships only when the parts provably sum to
the cell's value: a distinct count, a ratio or a semi-additive measure gets a plain refusal instead of
a misleading sum-of-parts list. And row security is reported as the roles that would filter
the tables involved, never as "computed under role X", because the engine cannot impersonate a role.
The same dossier is explain_value over MCP: free, read-only, and offline it degrades to
the metadata-only view and says so rather than inventing a value.
#Over MCP
The whole suite is dual-drive. Grouped by what they do:
- Query and read:
run_daxruns anEVALUATEquery,run_dmvruns a DMV,preview_tablepulls the first N rows, andpivot_measureevaluates a measure across a row-by-column matrix so you can sanity-check its values by category and date. - Author offline:
validate_daxchecks syntax and references before you write (no connection needed), andlint_daxruns about fifteen deterministic best-practice rules over an expression. - Measure and profile:
profile_daxreturns the FE/SE timings and heaviest scans,capture_query_planreturns the logical and physical plans,benchmark_daxgives first-run, warm-min and warm-median, andbenchmark_dax_coldwarmmeasures cold and warm with the SE split.clear_cacheevicts the VertiPaq cache so a cold measurement is meaningful, andevaluate_and_logruns a query withEVALUATEANDLOGand returns every logged intermediate. - Prove and optimise:
verify_dax_equivalenceproves a candidate rewrite matches the original across a filter-context matrix;probe_measureruns a measure across many contexts (grand total, single, multi, empty, boundary) to catch context-dependence bugs; andoptimize_measureruns the whole race (validate, verify, benchmark, apply the proven winner) and records the evidence. - Explain:
explain_valuebuilds the one-cell dossier described above: the value in its exact filter context, contributors, dependencies, lineage, and the why-is-this-blank checklist. Free and read-only.
# the optimise-and-prove loop
benchmark_dax           "EVALUATE ROW(\"v\", [Total Sales])"    # measure the baseline
verify_dax_equivalence  exprA=<current>  exprB=<rewrite>  groupBy=[Date[Year], Product[Category]]
optimize_measure measure:Sales/Total Sales candidates=[<rewriteA>, <rewriteB>] verifyGroupBy=[...]#What needs a live connection
Running, benchmarking, profiling, capturing plans, probing and proving equivalence all execute DAX,
so they need a live connection: a local Power BI Desktop instance or an XMLA endpoint. The
Formula/Storage split and the cold runs want a local Desktop or an admin XMLA endpoint, and degrade
gracefully to wall-clock only elsewhere. Authoring is different: validate_dax and
lint_dax are fully offline, so you can write and check measures with no connection at all.
A grand-total-only match is thin evidence, and Semanticus downgrades it to unverified rather than accept it. Pass representative group-by columns so "identical results" means identical everywhere it matters, not just at the total.