 Semanticus
Diagram
A live entity-relationship diagram of your model: tables coloured by role, relationships drawn with their real cardinality, and a layout that persists beside the model. It opens on a bus-matrix view so the star schema reads at a glance, and your AI Assistant sees the very same structure over MCP.
#In the Studio
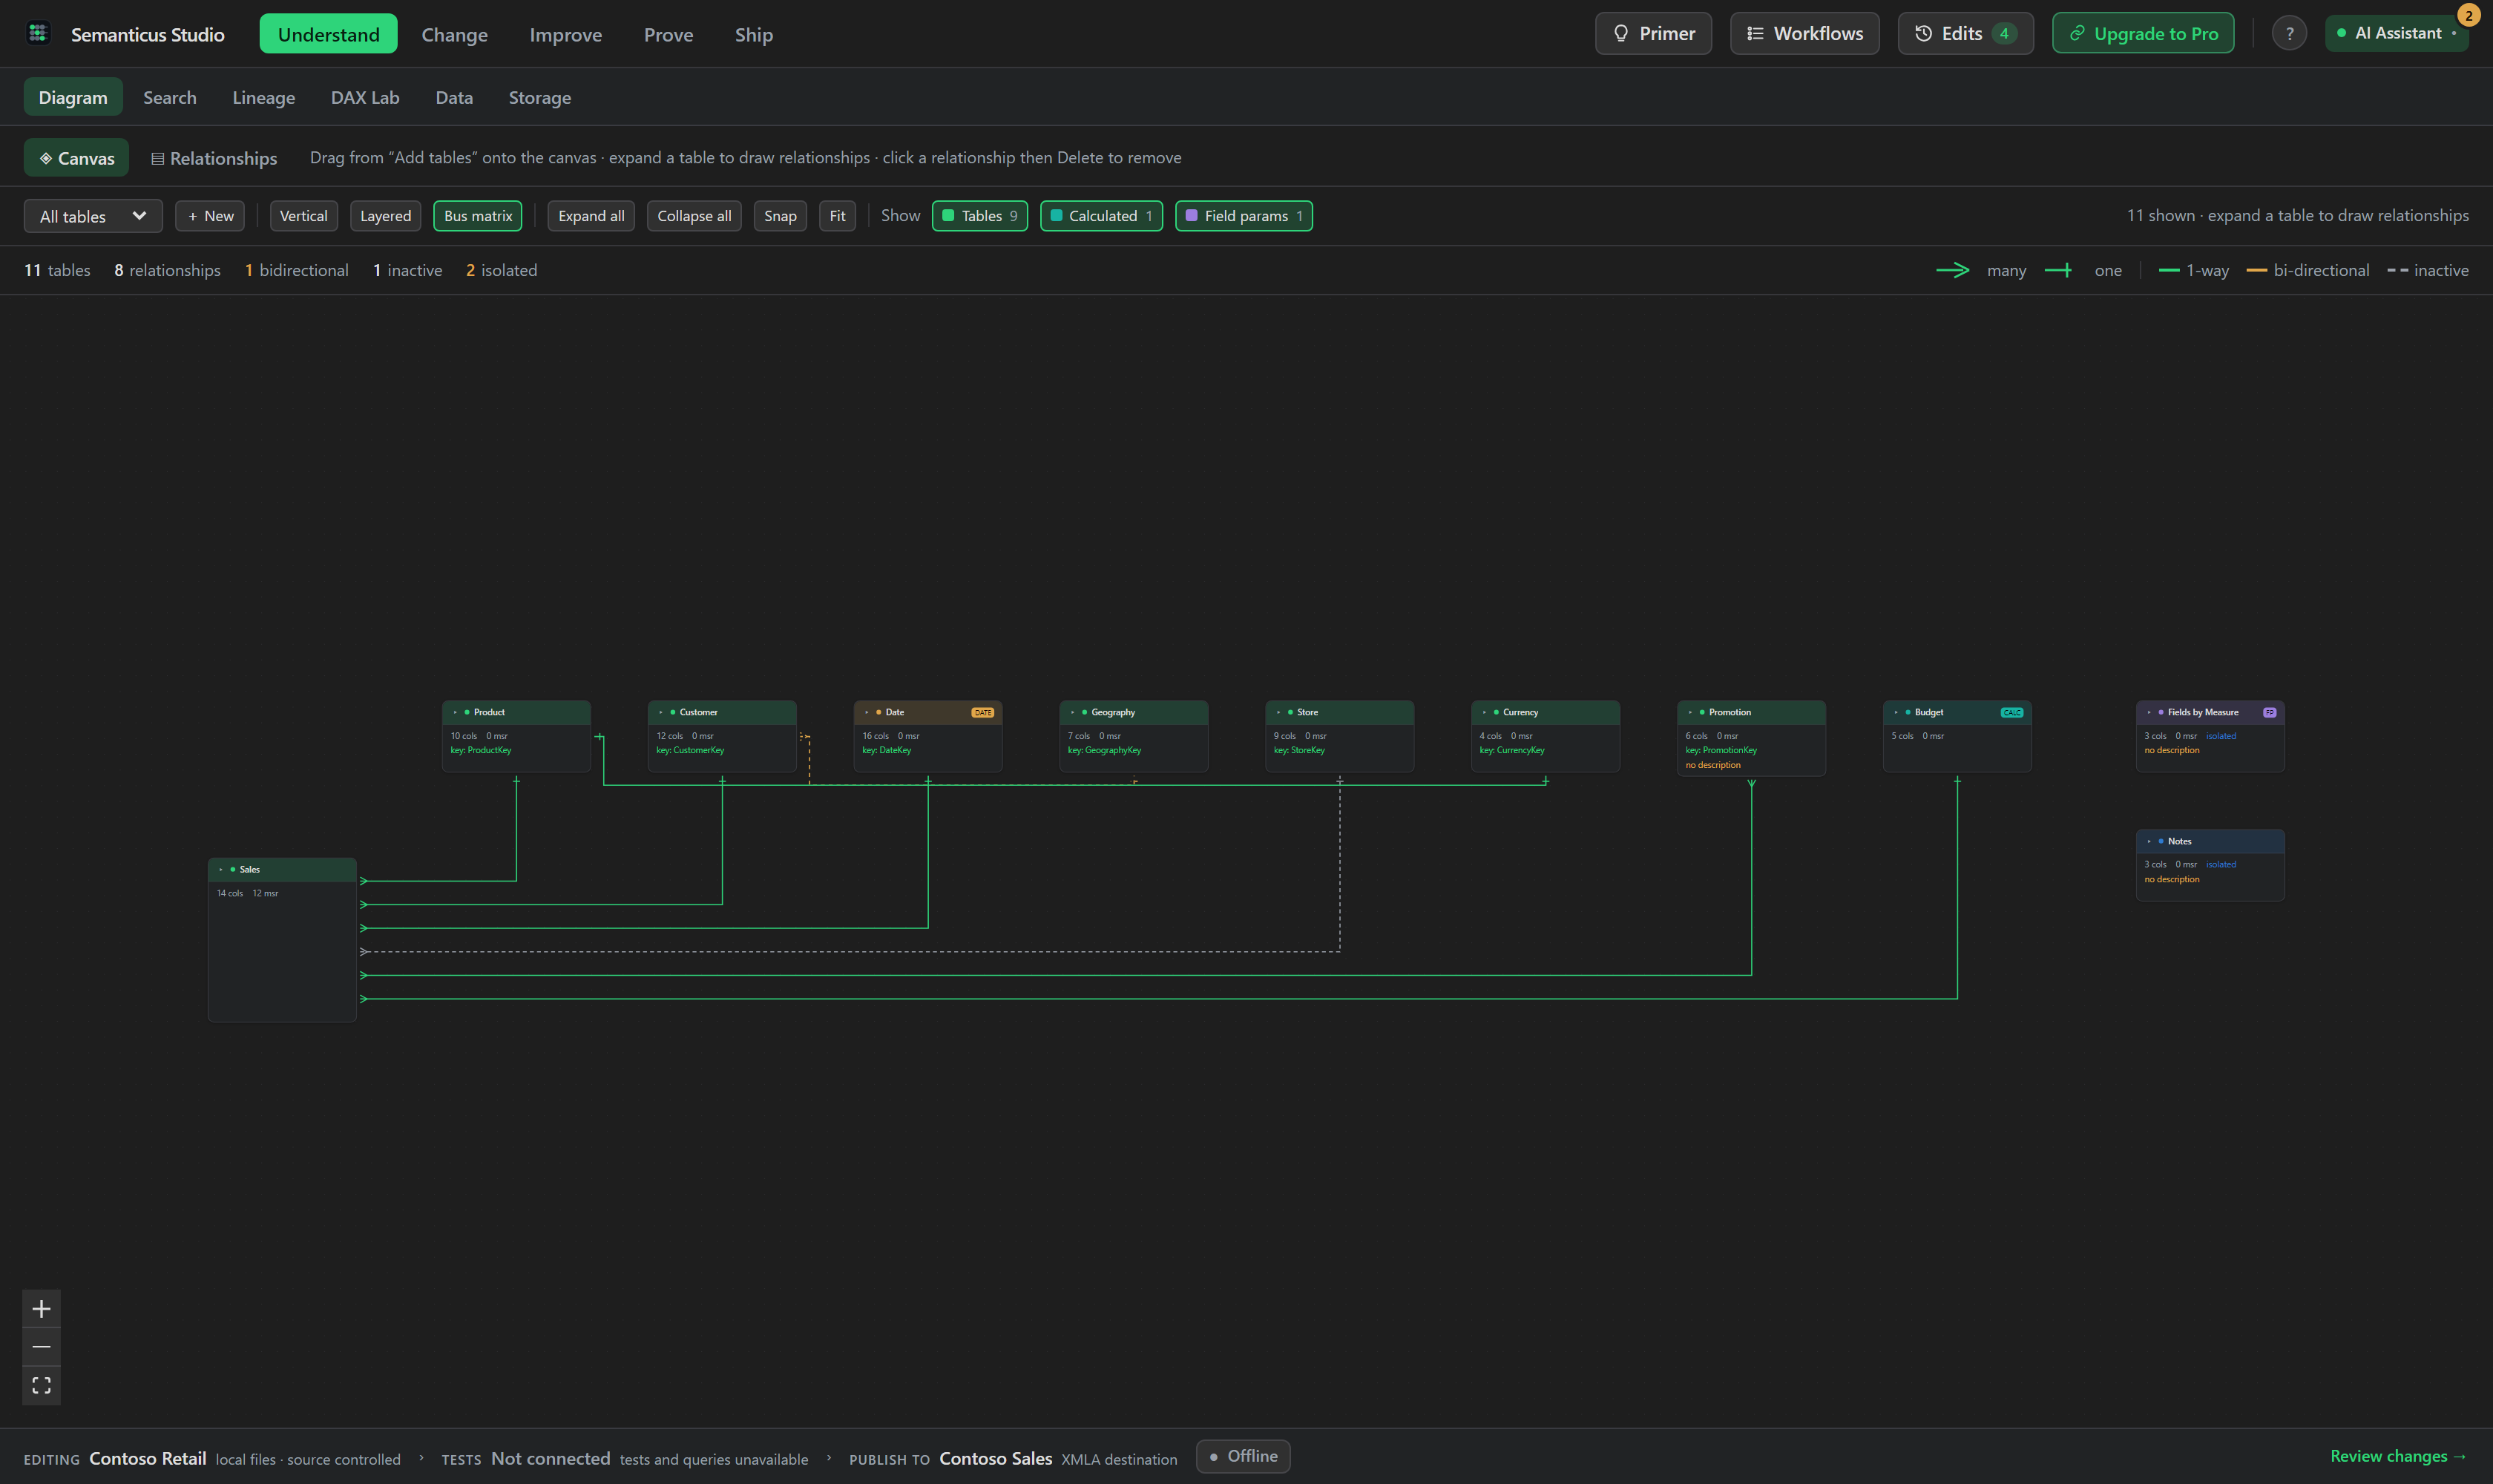
The Diagram tab renders tables as draggable nodes and relationships as typed edges, with automatic layout. It opens in a bus-matrix view by default so facts and the dimensions they share line up immediately; you can switch to layered or free layouts and use Auto-arrange or Fit.
Edges carry the real relationship shape: cardinality with crow's-foot markers, single versus bidirectional cross-filter, and active versus inactive state, each tinted to the line's state. Isolated tables (in no relationship at all, the classic star-schema smell) stand out at once.
Filters show or hide tables by kind, so you can strip the canvas back to the fact and dimension tables that matter. Field-parameter tables read as their own thing: they render in a distinct muted violet with an "FP" marker instead of hiding among plain calculated tables. Detection is deterministic and metadata-only, keyed on the marker Power BI Desktop writes, so both the Studio and your AI Assistant see the same truth and an ordinary calculated table is never mislabelled.
You build structure on the canvas. Use the + Add table picker to place a table, + related to pull in a table's neighbours, and ✕ remove to drop one from the view. To create a relationship, drag from a column on one table to a column on another. (VS Code does not allow dragging from the native model tree onto a webview, so tables enter through the in-canvas picker rather than a tree drag.) You can also drill from a table to its measures without leaving the diagram, and the positions you set survive reloads.
#Over MCP
The same structure and layout are available to your AI Assistant:
get_model_graphreturns what the diagram draws: every table (with column and measure counts, key columns, date-table and hidden flags) and every relationship (endpoints, cardinality, cross-filter direction, active/inactive).model_graph_summaryis the cheap first call on a large model: table and relationship counts, tables by type, the many-to-many / bidirectional / inactive breakdown, and the names of any disconnected visible tables.get_layoutreads the saved table positions andsave_layoutwrites them. A save merges with existing positions (tables you omit keep theirs) and re-keys each by a stable LineageTag, so a position survives a table rename.get_lineagereturns the directed dependency graph (sources, tables, columns, measures) when you want to reason about flow rather than shape (see Lineage & Impact).
model_graph_summary                 # -> counts + any disconnected visible tables
get_model_graph                     # -> full ER: tables + typed relationships
get_layout                          # -> saved x/y for placed tables
save_layout [{ ref: "table:Sales", x: 320, y: 120 }] # merges + re-keys by LineageTag#The layout follows the model, not the file
Positions are keyed by LineageTag, so renaming or re-saving a table keeps it where you put it. The
layout lives in a .semanticus/layout.json sidecar beside the model; it is not
a model edit, so it never appears in the model diff and a tidy diagram never shows up as a pending
change when you deploy or commit. Semanticus also reads Power BI Desktop's own
diagramLayout.json as a read-only base layer and overlays your saved positions on top, so
it never writes that native file.
The diagram redraws on model/didChange. Add a relationship over MCP or in the properties
grid and the edge appears immediately, tinted to its cardinality and cross-filter state, no refresh
needed.